CodingBatでアルゴリズム100本ノック
これまでの自分のプログラミングは機械学習周辺に偏っていて、コンピューターサイエンスやったことある人間が通ってくる基本的なアルゴリズムについての知識が足りていないとの指摘を受けたので、その部分を埋めるためにCodingBatにチャレンジしてみた。
Coding Bat
http://codingbat.com/
簡単なアルゴリズムをひたすら書かせるプログラミングサイトで、初めの一歩として楽しくできた。
自分のコードはGitHubに載せておくことにする。
次はもう少し難しいアルゴリズムを練習するために、積読になっているこの本を練習する予定。

世界で闘うプログラミング力を鍛える150問 トップIT企業のプログラマになるための本
- 作者: Gayle Laakmann McDowell
- 出版社/メーカー: マイナビ出版
- 発売日: 2012/11/13
- メディア: Kindle版
- この商品を含むブログ (3件) を見る
Scikit-learnのpipeleine.Pipelineが便利
分析する際に、次元圧縮→分類のような流れで行う場合には、scikit-learnのPipelineが便利。特にハイパーパラメーターを探すときには手続が煩雑になることもありますが、まとめて分類器としててGridSearchCVに突っ込むだけで良いのでめんどくさいこと考えずに済みますね。
今回はScikit-learnのサンプルデータの中から、the digits datasetのデータをロードし、PCAでの次元圧縮からSVMでの分類をPipelineでまとめて実行する手順を確認してみました。
コード
まずはデータを読み込み、訓練データとテストデータに分割。
また手書き文字のデータがどんなものかを描き出します。
import numpy as np

from sklearn import svm
from sklearn.decomposition import PCA

from sklearn import datasets
from sklearn.grid_search import GridSearchCV
from sklearn.pipeline import Pipeline
from sklearn.cross_validation import train_test_split
from sklearn import metrics

from matplotlib import pyplot as plt
from matplotlib import cm
%matplotlib inline

digits = datasets.load_digits()
X = digits.data
y = digits.target
print 'Number of data = {0}, Dimension = {1}'.format(X.shape[0],X.shape[1])

p = np.random.random_integers(0, len(digits.data), 25)
for index, (data, label) in enumerate(np.array(zip(digits.data, digits.target))[p]):
    plt.subplot(5, 5, index + 1)
    plt.axis('off')
    plt.imshow(data.reshape(8, 8), cmap=plt.cm.gray_r, interpolation='nearest')
    plt.title('%i' % label)
plt.show()


#Split the data
X_train, X_test, y_train, y_test = train_test_split(X, y, test_size=0.2)

Number of data = 1797, Dimension = 64

続いて、PCAで次元削減、SVMでの分類という2つの手順を一つのPipelineで分類器としてまとめます。
今回グリッドサーチでパラメータ探索するためにリスト形式で候補を入れてます。
複数の関数にまたがってパラメーターを指定することになるため、ハイフン二つの後にパラメーター名を指定することで、コントラクタに渡すようになってます。
estimators = [('pca', PCA()),
              ('svm', svm.SVC())]


parameters = {"pca__n_components" : range(2, 6),
              "svm__kernel" : ["linear", "poly", "rbf", "sigmoid"],
              'svm__C': np.logspace(0, 2, 10).tolist(),
              "svm__gamma": np.logspace(-3, 0, 10).tolist()}

pl = Pipeline(estimators)
最後にplを一つの分類器としてみなし、そのままGridSearchCVに突っ込みます。
clf = GridSearchCV(pl, parameters, n_jobs=-1)
clf.fit(X_train, y_train)
print 'Best_estimator = {0}'.format(clf.best_estimator_.get_params())

#予測
Predict = clf.predict(X_test)

n_samples = len(digits.data)
expected = digits.target[n_samples * -4 / 10:]
predicted = clf.predict(digits.data[n_samples * -4 / 10:])


print("Classification report for classifier %s:\n%s\n"
      % (clf, metrics.classification_report(expected, predicted)))
print("Confusion matrix:\n%s" % metrics.confusion_matrix(expected, predicted))

Best_estimator = {'svm__max_iter': -1, 'svm__coef0': 0.0, 'svm': SVC(C=1.6681005372, cache_size=200, class_weight=None, coef0=0.0,
  decision_function_shape=None, degree=3, gamma=0.01, kernel='rbf',
  max_iter=-1, probability=False, random_state=None, shrinking=True,
  tol=0.001, verbose=False), 'svm__random_state': None, 'pca__copy': True, 'svm__degree': 3, 'pca__n_components': 5, 'svm__gamma': 0.01, 'svm__shrinking': True, 'pca__whiten': False, 'svm__tol': 0.001, 'svm__verbose': False, 'svm__C': 1.6681005372000588, 'steps': [('pca', PCA(copy=True, n_components=5, whiten=False)), ('svm', SVC(C=1.6681005372, cache_size=200, class_weight=None, coef0=0.0,
  decision_function_shape=None, degree=3, gamma=0.01, kernel='rbf',
  max_iter=-1, probability=False, random_state=None, shrinking=True,
  tol=0.001, verbose=False))], 'svm__probability': False, 'svm__class_weight': None, 'pca': PCA(copy=True, n_components=5, whiten=False), 'svm__decision_function_shape': None, 'svm__kernel': 'rbf', 'svm__cache_size': 200}
Classification report for classifier GridSearchCV(cv=None, error_score='raise',
       estimator=Pipeline(steps=[('pca', PCA(copy=True, n_components=None, whiten=False)), ('svm', SVC(C=1.0, cache_size=200, class_weight=None, coef0=0.0,
  decision_function_shape=None, degree=3, gamma='auto', kernel='rbf',
  max_iter=-1, probability=False, random_state=None, shrinking=True,
  tol=0.001, verbose=False))]),
       fit_params={}, iid=True, n_jobs=-1,
       param_grid={'pca__n_components': [2, 3, 4, 5], 'svm__C': [1.0, 1.6681005372000588, 2.7825594022071245, 4.641588833612778, 7.742636826811269, 12.91549665014884, 21.544346900318832, 35.93813663804626, 59.94842503189409, 100.0], 'svm__gamma': [0.001, 0.0021544346900318843, 0.004641588833612777, 0.01, 0.021544346900318832, 0.046415888336127774, 0.1, 0.21544346900318823, 0.46415888336127775, 1.0]},
       pre_dispatch='2*n_jobs', refit=True, scoring=None, verbose=0):
             precision    recall  f1-score   support

          0       1.00      0.96      0.98        71
          1       0.99      0.97      0.98        73
          2       0.94      0.93      0.94        71
          3       0.95      0.96      0.95        74
          4       0.96      0.96      0.96        74
          5       0.97      1.00      0.99        71
          6       0.99      1.00      0.99        74
          7       0.93      0.92      0.92        72
          8       0.84      0.85      0.85        68
          9       0.90      0.92      0.91        71

avg / total       0.95      0.95      0.95       719


Confusion matrix:
[[68  0  0  0  2  0  1  0  0  0]
 [ 0 71  0  0  0  0  0  1  0  1]
 [ 0  0 66  1  0  0  0  0  2  2]
 [ 0  0  0 71  0  0  0  2  0  1]
 [ 0  0  0  0 71  0  0  0  3  0]
 [ 0  0  0  0  0 71  0  0  0  0]
 [ 0  0  0  0  0  0 74  0  0  0]
 [ 0  1  0  0  0  0  0 66  5  0]
 [ 0  0  4  0  1  0  0  2 58  3]
 [ 0  0  0  3  0  2  0  0  1 65]]
Spark MLlibの協調フィルタリングを活用したMovie Recommendation
Sparkを触る機会が増えてきてるので、知識の棚卸しを兼ねてMLlib使ってレコメンデーションシステムを実装してみました。SparkSamit2014などMLlibのチュートリアル的に色々使われているSparkのMovie Recommendationですが、edXのIntroduction to Big Data with Apache Sparが内容的にも良さそうだったので、題材にしながら実装しました。本講座はSpark 1.3.1での実装ですが少し古すぎるので、1.6.1で使える機能は使う形でコード変えてます。
おおまかな手順
①データの準備
元データを訓練、評価、テストデータにそれぞれ分割
②評価数500以上の映画の中から平均評価点が高いものを表示
③協調フィルタリングの実装
④訓練データに自分をuserID"0"として加え、好きな映画を評価
⑤自分の評価をもとに、アルゴリズムに映画を推薦させる
コード
まずはデータを読み込んで分割、眺めてみます。
使うデータはUserID::MovieID::Rating::Timestampで構成されるmovieデータセットと、MovieID::Title::Genresで構成されるRatingデータセットがあります。
numPartitions = 2

ratingFileName = "ratings.txt"
rawRatings = sc.textFile(ratingFileName, numPartitions)

moviesFileName = "movies.txt"
rawMovies = sc.textFile(moviesFileName, numPartitions)

def get_ratings_tuple(entry):
    items = entry.split('::')
    return int(items[0]), int(items[1]), float(items[2])

def get_movie_tuple(entry):
    items = entry.split('::')
    return int(items[0]), items[1]

ratingsRDD = rawRatings.map(get_ratings_tuple).cache()
moviesRDD = rawMovies.map(get_movie_tuple).cache()

ratingsCount = ratingsRDD.count()
moviesCount = moviesRDD.count()

print 'There are %s ratings and %s movies in the datasets' % (ratingsCount, moviesCount)
print 'Ratings: %s' % ratingsRDD.take(3)
print 'Movies: %s' % moviesRDD.take(3)

There are 1000209 ratings and 3883 movies in the datasets
Ratings: [(1, 1193, 5.0), (1, 661, 3.0), (1, 914, 3.0)]
Movies: [(1, u'Toy Story (1995)'), (2, u'Jumanji (1995)'), (3, u'Grumpier Old Men (1995)')]
どのような映画が人気か調べるため500以上のReviewがある中で、人気の高いものを20個選び出します。
MovieIDと評価の数、平均評価点を含むRDDを作成し、それとmovieRDDをjoinさせることで、(平均評価点、映画のタイトル、評価数)を持つタプルを生成します。
その後、評価数が500個以上あるタイトルのみ選び出し、平均評価点でソートしたものを求めます。
評価点と映画のタイトルのアルファベット順でのソートのためにsortFunction()という関数を作ってます。
def getCountsAndAverages(IDandRatingsTuple):
    aggr_result = (IDandRatingsTuple[0], (len(IDandRatingsTuple[1]), float(sum(IDandRatingsTuple[1])) / len(IDandRatingsTuple[1])))
    return aggr_result


movieNameWithAvgRatingsRDD = (ratingsRDD
                          .map(lambda x:(x[1], x[2]))
                          .groupByKey()
                          .map(getCountsAndAverages)
                          .join(moviesRDD)
                          .map(lambda x:(x[1][0][1], x[1][1], x[0])))


print 'movieNameWithAvgRatingsRDD: %s\n' % movieNameWithAvgRatingsRDD.take(3)


def sortFunction(tuple):
    key = unicode('%.3f' % tuple[0])
    value = tuple[1]
    return (key + ' ' + value)

movieLimitedAndSortedByRatingRDD = (movieNameWithAvgRatingsRDD
                                    .filter(lambda x: (x[2] > 500))
                                    .sortBy(sortFunction, False))

print 'Movies with highest ratings:'
print '(average rating, movie name, number of reviews)'
for ratingsTuple in movieLimitedAndSortedByRatingRDD.take(10):
    print ratingsTuple


movieNameWithAvgRatingsRDD: [(3.49618320610687, u'Great Mouse Detective, The (1986)', 2048), (3.7871690427698574, u'Moonstruck (1987)', 3072), (2.7294117647058824, u'Waiting to Exhale (1995)', 4)]


Movies with highest ratings:
(average rating, movie name, number of reviews)
(5.0, u'Ulysses (Ulisse) (1954)', 3172)
(5.0, u'Song of Freedom (1936)', 3382)
(5.0, u'Smashing Time (1967)', 3233)
(5.0, u'Schlafes Bruder (Brother of Sleep) (1995)', 989)
(5.0, u'One Little Indian (1973)', 3607)
(5.0, u'Lured (1947)', 3656)
(5.0, u'Gate of Heavenly Peace, The (1995)', 787)
(5.0, u'Follow the Bitch (1998)', 1830)
(5.0, u'Bittersweet Motel (2000)', 3881)
(5.0, u'Baby, The (1973)', 3280)
次に協調フィルタリングを使用したレコメンデーションを実施します。
MLlibにはALSを使ったライブラリがあるのでそのまんま活用します。
ひとまずモデル構築のために訓練、評価、テストデータにデータセットを分割します。
trainingRDD, validationRDD, testRDD = ratingsRDD.randomSplit([6, 2, 2], seed=0)

print 'Training: %s, validation: %s, test: %s\n' % (trainingRDD.count(),
                                                    validationRDD.count(),
                                                    testRDD.count())
print trainingRDD.take(3)
print validationRDD.take(3)
print testRDD.take(3)

validationForPredictRDD = validationRDD.map(lambda x: (x[0], x[1]))
print validationForPredictRDD.take(3)

actualReformattedRDD = validationRDD.map(lambda x: ((x[0], x[1]), x[2]))
print actualReformattedRDD.take(3)


Training: 600364, validation: 199815, test: 200030

[(1, 661, 3.0), (1, 914, 3.0), (1, 1197, 3.0)]
[(1, 3408, 4.0), (1, 2355, 5.0), (1, 938, 4.0)]
[(1, 1193, 5.0), (1, 1287, 5.0), (1, 2804, 5.0)]
[(1, 3408), (1, 2355), (1, 938)]
[((1, 3408), 4.0), ((1, 2355), 5.0), ((1, 938), 4.0)]
モデル構築ですが、グリッドサーチによってより良いパラメーターを探します。
またモデルの評価にはMLlibに用意されている指標の中で平均二乗誤差の平方根(RMSE)を使います。
from pyspark.mllib.recommendation import ALS
from pyspark.mllib.evaluation import RegressionMetrics

seed = 5L
iterations = [5,7,10]
regularizationParameter = 0.1
ranks = [4, 8, 12]
RMSEs = [0, 0, 0, 0, 0, 0, 0, 0, 0]
err = 0
tolerance = 0.03

minRMSE = float('inf')
bestRank = -1
bestIteration = -1
for rank in ranks:
    for iteration in iterations:
        model = ALS.train(trainingRDD,
                          rank,
                          seed=seed,
                          iteration,
                          lambda_=regularizationParameter)
        predictedRatingsRDD = model.predictAll(validationForPredictRDD)
        predictedReformattedRDD = predictedRatingsRDD.map(lambda x: ((x[0], x[1]), x[2]))

        predictionAndObservations = (predictedReformattedRDD
                                     .join(actualReformattedRDD)
                                     .map(lambda x: x[1]))

        metrics = RegressionMetrics(predictionAndObservations)
        RMSE = metrics.rootMeanSquaredError
        RMSEs[err] = RMSE
        err += 1

        print 'For rank %s and itereation %s, the RMSE is %s' % (rank, iteration, RMSE)
        if RMSE < minRMSE:
            minRMSE = RMSE
            bestIteretioin = iteretaion
            bestRank = rank

print 'The best model was trained with rank %s and iteratin %s'  % (bestRank, bestIteretion)


For rank 4 and itereation 5, the RMSE is 0.903719946201
For rank 4 and itereation 7, the RMSE is 0.893408395534
For rank 4 and itereation 10, the RMSE is 0.886260195446
For rank 8 and itereation 5, the RMSE is 0.89365207233
For rank 8 and itereation 7, the RMSE is 0.883901283207
For rank 8 and itereation 10, the RMSE is 0.876701840863
For rank 12 and itereation 5, the RMSE is 0.887127524585
For rank 12 and itereation 7, the RMSE is 0.87863327159
For rank 12 and itereation 10, the RMSE is 0.872532683651
The best model was trained with rank 12 and iteratin 10
テストデータでチェックします。RMSEに問題ないので過学習は起こしてなさそうです。
bestModel = ALS.train(trainingRDD,
                      bestRank,
                      seed=seed,
                      iterations=bestIteretion,
                      lambda_=regularizationParameter)

testForPredictingRDD = testRDD.map(lambda x: (x[0], x[1]))
testReformattedRDD = testRDD.map(lambda x: ((x[0], x[1]), x[2]))

predictedTestRDD = bestModel.predictAll(testForPredictingRDD)
predictedTestReformattedRDD = predictedTestRDD.map(lambda x: ((x[0], x[1]), x[2]))

predictionAndObservationsTest = (predictedTestReformattedRDD
                             .join(testReformattedRDD)
                             .map(lambda x: x[1]))

metrics = RegressionMetrics(predictionAndObservationsTest)
testRMSE = metrics.rootMeanSquaredError

print 'The model had a RMSE on the test set of %s' % testRMSE


The model had a RMSE on the test set of 0.87447554868
最後に自分の好きな映画を評価し、userID"0"としてデータに追加。その評価に基づいて映画を推薦してもらいます。
movieRDDから自分の好きな映画を取り出して評価して加え、モデルの訓練に使用します。その後、userID"0"向けの予測を得て、評価点の高いものから表示するようにします。
myUserID = 0
myRatedMovies = [(myUserID, 1, 5), #Toy Story
                 (myUserID, 648, 3), # Mission Impossible
                 (myUserID, 1580, 4), # Men In Black
                 (myUserID, 1097, 3), # ET
                 (myUserID, 3247, 5)] #Sister Act

myRatingsRDD = sc.parallelize(myRatedMovies)
trainingWithMyRatingsRDD = trainingRDD.union(myRatingsRDD)

myRatingsModel = ALS.train(trainingWithMyRatingsRDD,
                           bestRank,
                           seed=seed,
                           iterations=bestIteretion,
                           lambda_=regularizationParameter)


myUnratedMoviesRDD = (moviesRDD
                      .filter(lambda x: x[0] not in [x[1] for x in myRatedMovies])
                      .map(lambda x: (myUserID, x[0])))

predictedRatingsRDD = myRatingsModel.predictAll(myUnratedMoviesRDD)
predictedRDD = predictedRatingsRDD.map(lambda x: (x[1], x[2]))

movieCountsRDD = (ratingsRDD
                  .map(lambda x:(x[1], x[2]))
                  .groupByKey()
                  .map(getCountsAndAverages)
                  .map(lambda x: (x[0], x[1][0])))


#Marge PredictedRDD and CountsRDD
predictedWithCountsRDD  = (predictedRDD
                           .join(movieCountsRDD))


ratingsWithNamesRDD = (predictedWithCountsRDD
                       .filter(lambda x: x[1][1] > 75)
                       .join(moviesRDD)
                       .map(lambda x: (x[1][0][0], x[1][1], x[1][0][1])))

predictedHighestRatedMovies = ratingsWithNamesRDD.takeOrdered(10, key=lambda x: -x[0])
print ('My highest rated movies as predicted (for movies with more than 75 reviews):\n%s' %
        '\n'.join(map(str, predictedHighestRatedMovies)))

My highest rated movies as predicted (for movies with more than 75 reviews):
(4.74482593848827, u'Sound of Music, The (1965)', 882)
(4.580669496447569, u'Mary Poppins (1964)', 1011)
(4.486424714752521, u'Beauty and the Beast (1991)', 1060)
(4.478042748281928, u'Mulan (1998)', 490)
(4.477453571213953, u'Toy Story 2 (1999)', 1585)
(4.439390718632932, u'Fantasia 2000 (1999)', 453)
(4.405894101045507, u'FairyTale: A True Story (1997)', 87)
(4.4030583744108425, u"Singin' in the Rain (1952)", 751)
(4.390333274084924, u'Top Hat (1935)', 251)
(4.347757079374581, u'Gone with the Wind (1939)', 1156)
ベタな映画を評価してるので、ベタな映画が推薦されてますね笑
Spark MllibでのClick through rate(CRT) 予測
1年以上も前ですが、edXのScalable Machine learningを受講していた時のコードが出てきたので、見直してみました。この講座のネタが、KaggleのCriteoのコンペのデータ
を基にしたCTR予測でして、One-hot-encodingやhushingした高次元のデータを
Mllibのロジスティック回帰モデル
)で予測をするといったものです。今回は予測精度そのものよりも、ハッシュ関数で次元圧縮したものが、OHE化したデータと比べてどの程度予測精度に差が出るのかを見ていきます。
Sparkもかなり前のバージョンだったので、今ならまた違う実装の仕方があるような気もしますが、出来合いの機能に頼らずに実装したことで理解が深まった記憶があるので、そのまんま。追加機能の勉強兼ねた比較はまた別のタイミングで行いたいなと思います。 SparkはVirtualbox上にたてたUbuntuにインストールしたものをシングルノードで使用しています。
おおまかな手順
①データの準備
元データを訓練、評価、テストデータにそれぞれ分割
②元データにOHEを適用。ここで特徴量は20万以上になります。
③OHE後のデータでロジスティック回帰で分析(model1)
④ハッシュトリックで次元量の削減(およそ3,000程度)
⑤ハッシュ後のデータでロジスティック回帰分析
-Mllibデフォルト設定のモデル(model2)
-グリッドサーチでパラメータ設定したモデル(model3)
⑥Loglosによるモデル評価
-OHEデータモデル(model1) vs Hushingデータモデル(model2)
-Hushingデータ・デフォルトモデル(model2) vs Hushingデータ・GSモデル(model3)
コード
まずはデータを読み込んで分割、眺めてみます。
import numpy as np
from pyspark.mllib.linalg import SparseVector
from pyspark.mllib.regression import LabeledPoint

rawData = (sc.textFile("dac_sample.txt").map(lambda x: x.replace('\t', ',')))

OneSample = rawData.take(1)
print OneSample


weights = [.8, .1, .1]
seed = 42
rawTrainData, rawValidationData, rawTestData = rawData.randomSplit(weights, seed)

#Cache each datasets as it is used repeatedly
rawTrainData.cache()
rawValidationData.cache()
rawTestData.cache()

nTrain = rawTrainData.count()
nVal = rawValidationData.count()
nTest = rawTestData.count()
print nTrain, nVal, nTest, nTrain + nVal + nTest


[u'0,1,1,5,0,1382,4,15,2,181,1,2,,2,68fd1e64,80e26c9b,fb936136,7b4723c4,25c83c98,7e0ccccf,de7995b8,1f89b562,a73ee510,a8cd5504,b2cb9c98,37c9c164,2824a5f6,1adce6ef,8ba8b39a,891b62e7,e5ba7672,f54016b9,21ddcdc9,b1252a9d,07b5194c,,3a171ecb,c5c50484,e8b83407,9727dd16']
79911 10075 10014 100000
OHEを分割したデータに当てます。
def createOneHotDict(inputData):
    OHEDict = (inputData
               .flatMap(lambda x: x)
               .distinct()
               .zipWithIndex()
               .collectAsMap())
    return OHEDict


def parsePoint(point):
    items = point.split(',')
    return [(i, item) for i, item in enumerate(items[1:])]

def oneHotEncoding(rawFeats, OHEDict, numOHEFeats):
    sizeList = [OHEDict[f] for f in rawFeats if f in OHEDict]
    sortedSizeList = sorted(sizeList)
    valueList = [1 for f in rawFeats if f in OHEDict ]
    return SparseVector(numOHEFeats, sortedSizeList, valueList)


def parseOHEPoint(point, OHEDict, numOHEFeats):
    parsedPoints = parsePoint(point)
    items = point.split(',')
    label = items[0]
    features = oneHotEncoding(parsedPoints, OHEDict, numOHEFeats)
    return LabeledPoint(label, features)

parsedFeat = rawTrainData.map(parsePoint)
ctrOHEDict = createOneHotDict(parsedFeat)
numCtrOHEFeats = len(ctrOHEDict.keys())


OHETrainData = rawTrainData.map(lambda point: parseOHEPoint(point, ctrOHEDict, numCtrOHEFeats)).cache()
OHEValidationData = rawValidationData.map(lambda point: parseOHEPoint(point, ctrOHEDict, numCtrOHEFeats)).cache()
OHETestData = rawTestData.map(lambda point: parseOHEPoint(point, ctrOHEDict, numCtrOHEFeats)).cache()

print ('Feature size after OHE:\n\tNumber of features = {0}'
       .format(numCtrOHEFeats))

print OHETrainData.take(1)

Feature size after OHE:
	Number of features = 233286
[LabeledPoint(0.0, (233286,[386,3077,6799,8264,8862,11800,12802,16125,17551,18566,29331,33132,39525,55794,61786,81396,82659,93573,96929,100677,109699,110646,112132,120260,128596,132397,132803,140620,160675,185498,190370,191146,195925,202664,204273,206055,222737,225958,229942],[1.0,1.0,1.0,1.0,1.0,1.0,1.0,1.0,1.0,1.0,1.0,1.0,1.0,1.0,1.0,1.0,1.0,1.0,1.0,1.0,1.0,1.0,1.0,1.0,1.0,1.0,1.0,1.0,1.0,1.0,1.0,1.0,1.0,1.0,1.0,1.0,1.0,1.0,1.0]))]
OHE後のデータにてロジスティック回帰を実施。とりあえずパラメーター設定はデフォルトのままやってみます。
from pyspark.mllib.classification import LogisticRegressionWithSGD

numIters = 100
stepSize = 1.0
regParam = 0.01
regType = 'l2'
includeIntercept = True

model0 = LogisticRegressionWithSGD.train(data = OHETrainData,
                                         iterations = numIters,
                                         step = stepSize,
                                         regParam = regParam,
                                         regType = regType,
                                         intercept = includeIntercept)

#Compute loglos
from math import log, exp

def computeLogLoss(p, y):
    epsilon = 10e-12
    if y == 1:
        return -log(epsilon + p) if p == 0 else -log(p)
    elif y == 0:
        return -log(1 - p + epsilon) if p == 1 else -log(1 - p)

def getP(x, w, intercept):
    rawPrediction = x.dot(w) + intercept

    # Bound the raw prediction value
    rawPrediction = min(rawPrediction, 20)
    rawPrediction = max(rawPrediction, -20)
    return 1.0 / (1.0 + exp(-rawPrediction))

def evaluateResults(model, data):
    return data.map(lambda x: computeLogLoss(getP(x.features, model.weights, model.intercept), x.label)).sum() / data.count()

logLossValLR0 = evaluateResults(model0, OHEValidationData)
print ('Validation Logloss for model1:\n\t = {0}'
       .format(logLossValLR0))
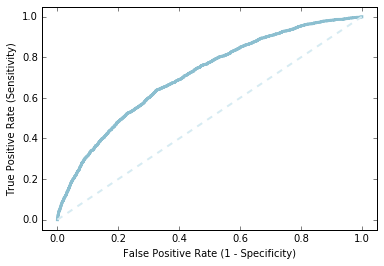
素うどんのロジスティック回帰でどこまで予測できてるか、ROC曲線を描いてみます。ぼちぼちの精度でできてるようでした。
labelsAndScores = OHEValidationData.map(lambda lp: (lp.label, getP(lp.features, model0.weights, model0.intercept)))
labelsAndWeights = labelsAndScores.collect()
labelsAndWeights.sort(key=lambda (k, v): v, reverse=True)
labelsByWeight = np.array([k for (k, v) in labelsAndWeights])

length = labelsByWeight.size
truePositives = labelsByWeight.cumsum()
numPositive = truePositives[-1]
falsePositives = np.arange(1.0, length + 1, 1.) - truePositives

truePositiveRate = truePositives / numPositive
falsePositiveRate = falsePositives / (length - numPositive)

import matplotlib.pyplot as plt
%matplotlib inline

fig = plt.figure()
ax = plt.subplot(111)

ax.set_xlim(-.05, 1.05), ax.set_ylim(-.05, 1.05)
ax.set_ylabel('True Positive Rate (Sensitivity)')
ax.set_xlabel('False Positive Rate (1 - Specificity)')
plt.plot(falsePositiveRate, truePositiveRate, color='#8cbfd0', linestyle='-', linewidth=3.)
plt.plot((0., 1.), (0., 1.), linestyle='--', color='#d6ebf2', linewidth=2.)
次に元データに対してハッシュトリックを当てます。
OHE後の次元数は20万程度、今回ハッシュ関数のバケット数を2の15乗で32768個としてます。
from collections import defaultdict
import hashlib

def hashFunction(numBuckets, rawFeats, printMapping=False):
    mapping = {}
    for ind, category in rawFeats:
        featureString = category + str(ind)
        mapping[featureString] = int(int(hashlib.md5(featureString).hexdigest(), 16) % numBuckets)
    sparseFeatures = defaultdict(float)
    for bucket in mapping.values():
        sparseFeatures[bucket] += 1.0
    return dict(sparseFeatures)


def parseHashPoint(point, numBuckets):
    parsedPoints = parsePoint(point)
    items = point.split(',')
    label = items[0]
    features = hashFunction(numBuckets, parsedPoints, printMapping=False)
    return LabeledPoint(label, SparseVector(numBuckets, features))

numBucketsCTR = 2 ** 15
hashTrainData = rawTrainData.map(lambda x: parseHashPoint(x, numBucketsCTR))
hashTrainData.cache()
hashValidationData = rawValidationData.map(lambda x: parseHashPoint(x, numBucketsCTR))
hashValidationData.cache()
hashTestData = rawTestData.map(lambda x: parseHashPoint(x, numBucketsCTR))
hashTestData.cache()

print ('Feature size after hushing:\n\tNumber of features = {0}'
       .format(numBucketsCTR))

print hashTrainData.take(1)

Feature size after hushing:
	Number of features = 32768
[LabeledPoint(0.0, (32768,[1305,2883,3807,4814,4866,4913,6952,7117,9985,10316,11512,11722,12365,13893,14735,15816,16198,17761,19274,21604,22256,22563,22785,24855,25202,25533,25721,26487,26656,27668,28211,29152,29402,29873,30039,31484,32493,32708],[1.0,1.0,1.0,1.0,1.0,1.0,1.0,1.0,1.0,1.0,1.0,1.0,1.0,1.0,1.0,1.0,1.0,1.0,1.0,1.0,1.0,1.0,1.0,1.0,1.0,1.0,1.0,1.0,1.0,1.0,1.0,1.0,1.0,1.0,1.0,1.0,1.0,1.0]))]
ハッシュ関数をあてた後のデータにてロジスティック分析。
デフォルト設定のものと、グリッドサーチでパラメータを探したものと二つモデルを作ります。
まずは素うどんの方から。
numIters = 100
stepSize = 1.0
regParam = 0.01
regType = 'l2'
includeIntercept = True

model1 = LogisticRegressionWithSGD.train(data = hashTrainData,
                                         iterations = numIters,
                                         step = stepSize,
                                         regParam = regParam,
                                         regType = regType,
                                         intercept = includeIntercept)

logLossValLR1 = evaluateResults(model1, hashValidationData)
print ('Validation Logloss for model1:\n\t = {0}'
       .format(logLossValLR1))

Validation Logloss for model1:
	 = 0.482691122185
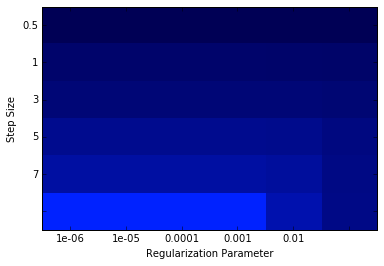
次にグリッドサーチを実施してモデル構築します。
numIters = 500
stepSizes = [0.1, 0.5, 1, 3, 5, 7]
regParams = [1e-7, 1e-6, 1e-5, 1e-4, 1e-3, 1e-2]
regType = 'l2'
includeIntercept = True


# Initialize variables using values from initial model training
bestModel = None
bestLogLoss = 1e10
logLoss = np.zeros((len(stepSizes),len(regParams)))

for i in xrange(len(stepSizes)):
    for j in xrange(len(regParams)):
        model = LogisticRegressionWithSGD.train(data = hashTrainData,
                                                iterations = numIters,
                                                step = stepSizes[i],
                                                regParam = regParams[j],
                                                regType = regType,
                                                intercept = includeIntercept)

        logLoss[i, j] = evaluateResults(model, hashValidationData)

        if (logLoss[i, j] < bestLogLoss):
            bestModel = model
            bestStepsize = stepSizes[i]
            bestParams = regParams[j]
            bestLogLoss = logLoss[i,j]


print ('best parameters:\n\tBest Stepsize = {0:.3f}\n\tBest Rarams = {1:.3f}'
       .format(bestStepsize, bestParams))

print bestParams,logLoss

%matplotlib inline
from matplotlib.colors import LinearSegmentedColormap


numRows, numCols = len(stepSizes), len(regParams)
logLoss = np.array(logLoss)
logLoss.shape = (numRows, numCols)

fig = plt.figure()
ax = plt.subplot(111)


ax.set_xticklabels(regParams), ax.set_yticklabels(stepSizes)
ax.set_xlabel('Regularization Parameter'), ax.set_ylabel('Step Size')

colors = LinearSegmentedColormap.from_list('blue', ['#0022ff', '#000055'], gamma=.2)
image = plt.imshow(logLoss,interpolation='nearest', aspect='auto',
                    cmap = colors)
pass

best parameters:
	Best Stepsize = 7.000
	Best Rarams = 0.000
1e-07 [[ 0.51910013  0.51910015  0.51910029  0.51910175  0.51911634  0.51926454]
 [ 0.48589729  0.4858974   0.48589847  0.48590921  0.48605802  0.48715278]
 [ 0.47476165  0.47476184  0.47476375  0.47478289  0.4750353   0.47731296]
 [ 0.46130496  0.46130542  0.46131004  0.46137622  0.46208485  0.46799094]
 [ 0.45587263  0.45587339  0.45588094  0.45600577  0.45715016  0.465792  ]
 [ 0.45268179  0.45268281  0.45270706  0.45286577  0.45438559  0.46488834]]
最期に下記の軸によるLoglosによるモデル評価です。
-OHEデータモデル(model1) vs Hushingデータモデル(model2)
-Hushingデータ・デフォルトモデル(model2) vs Hushingデータ・GSモデル(model3)
Loglossでの比較では、次元量を圧縮したHushing後のデータを使っても予測精度が落ちていませんね、面白いです。
logLossTestLR0 = evaluateResults(model0, OHETestData)
logLossTestLR1 = evaluateResults(model1, hashTestData)
logLossTestLRbest = evaluateResults(bestModel, hashTestData)

print ('OHECoding & Hashed Features Test Logloss:\n\tOHEModel = {0:.3f}\n\thashModel = {1:.3f}'
       .format(logLossTestLR0, logLossTestLR1))

print ('Hashed Features Validation Test Logloss:\n\tBaseModel = {0:.3f}\n\tBestModel = {1:.3f}'
       .format(logLossTestLR1, logLossTestLRbest))

OHECoding & Hashed Features Test Logloss:
	OHEModel = 0.490
	hashModel = 0.490
Hashed Features Validation Test Logloss:
	BaseModel = 0.490
	BestModel = 0.460
時系列解析① ARモデル
時系列データの解析を二つのデータに対して実施します。
基本的には、RawDataの確認、トレンドと季節性の排除、モデルのフィッティングの順にやっていきます。
データ①simulated data
Rで生成したデータについて分析してみます。
データを作成するコードは下記。
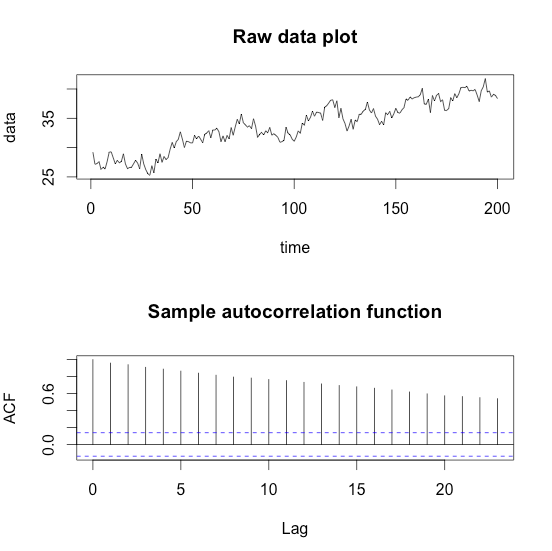
データのプロットと、自己相関関数を併せて出しておきます。
#### Generate time seriese data with a linear trend
>time <- 1:200
>data.ar <- arima.sim(model=list(ar=c(0.6, 0.3)), n=200, sd=1)
>data <- data.ar + 30 + 0.05 * time
>par(mfrow=c(2,1))
>plot(time, data, type="l", main="Raw data plot")
>acf(data, main="Sample autocorrelation function")
出てくるデータはこんな感じです。
グラフとコレログラム(Correlogram)から線形トレンドがありそうなので、こいつを取り除きます。
## Remove the trend
>linear.model <- lm(data~time)
>summary(linear.model)

Call:
lm(formula = data ~ time)

Residuals:
    Min      1Q  Median      3Q     Max
-3.7143 -1.0238 -0.0246  1.0379  3.7570

Coefficients:
             Estimate Std. Error t value Pr(>|t|)
(Intercept) 27.098000   0.207381   130.7   <2e-16 ***
time         0.065674   0.001789    36.7   <2e-16 ***

>residual.series <- data - linear.model$fitted.values
>par(mfrow=c(3,1))
>plot(residual.series, main="Residual series")
>acf(residual.series, main="ACF of Residual series")
>pacf(residual.series, main="PACF of Residual series")

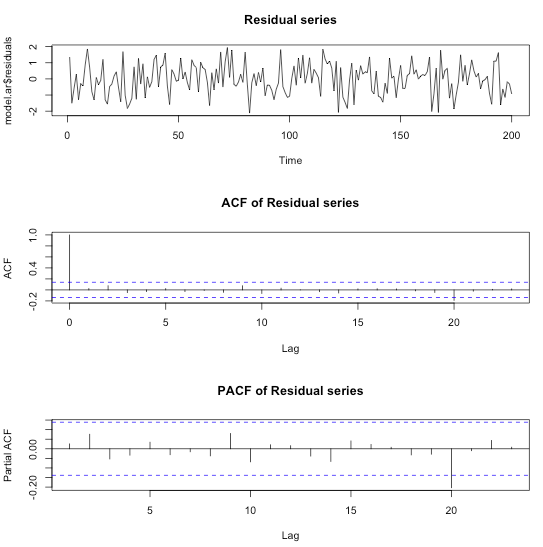
時系列プロットから定常性が確認でき偏自己相関から、AR(2)が妥当なオーダーだと判断出来ますので、早速モデル化。
## Fit an AR(2) model to the data
model.ar <- arima(residual.series, order=c(2,0,0))

par(mfrow=c(3,1))
plot(model.ar$residuals, main="Residual series")
acf(model.ar$residuals, main="ACF of Residual series")
pacf(model.ar$residuals, main="PACF of Residual series")
ARIMA()関数は残差をプロットしてくれます。
プロットを見る限り、残差に相関はなさそうなのでモデルが妥当だったということでしょう。
データ②Temperature Data
湖の温度を測ったデータを使っての時系列分析です。
データは私のGitHubに置いてあります。
GitHub:
https://github.com/tkazusa/Sample_code/tree/master/Data
> #Data import
> tempeature <- read.csv("temperature.csv", header=TRUE)
> t <- 1:nrow(tempeature)
> x <- tempeature$Temperature
> par(mfrow=c(2,1))
> plot(t,x, type="l", main="Raw data plot")
> acf(x,main="Temperature data ACF")
図から、先ほどの例とは異なり季節性が出ていることがわかります。

この季節性を取り除くために、下記のモデルを使います。
> model.season <- lm(x~sin(2*pi*t/365) + cos(2*pi*t/365))
> summary(model.season)

Call:
lm(formula = x ~ sin(2 * pi * t/365) + cos(2 * pi * t/365))

Residuals:
     Min       1Q   Median       3Q      Max
-10.3755  -2.1802  -0.0533   2.4349   9.0749

Coefficients:
                    Estimate Std. Error t value Pr(>|t|)
(Intercept)           6.4263     0.1029   62.47   <2e-16 ***
sin(2 * pi * t/365)  -2.5477     0.1455  -17.51   <2e-16 ***
cos(2 * pi * t/365)  -3.7933     0.1455  -26.07   <2e-16 ***
---
Signif. codes:  0 ‘***’ 0.001 ‘**’ 0.01 ‘*’ 0.05 ‘.’ 0.1 ‘ ’ 1

Residual standard error: 3.404 on 1092 degrees of freedom
Multiple R-squared:  0.4746,	Adjusted R-squared:  0.4736
F-statistic: 493.2 on 2 and 1092 DF,  p-value: < 2.2e-16

> residual.series <- x - model.season$fitted.values
> par(mfrow=c(3,1))
> plot(residual.series, main="Residual series", type="l")
> acf(residual.series, main="ACF of Residual series")
> pacf(residual.series, main="PACF of Residual series")

プロットからResidualデータは定常性があり、PACFからAR(1)モデルが妥当だと判断できますので、モデル化します。
>## Fit an AR(1) model
> model.ar <- arima(residual.series, order=c(1,0,0))
> model.ar

Call:
arima(x = residual.series, order = c(1, 0, 0))

Coefficients:
         ar1  intercept
      0.4861     0.0026
s.e.  0.0264     0.1746

sigma^2 estimated as 8.829:  log likelihood = -2746.36,  aic = 5498.72
> par(mfrow=c(3,1))
> plot(model.ar$residuals, main="Residual series")
> acf(model.ar$residuals, main="ACF of Residual series")
> pacf(model.ar$residuals, main="PACF of Residual series")
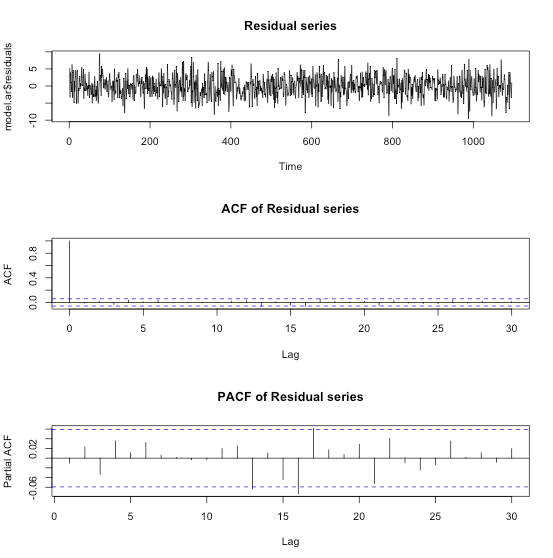
残差プロットやPACFより綺麗にモデル化できていると判断できます。
OLS、リッジ回帰、ラッソでのパフォーマンス比較
OLS、特徴選択、リッジ回帰、ラッソの4つの方法でTrainデータからモデルをFittingし、Testデータを用いて、平均2乗誤差(MSE)を推定して比べるといったことをします。
まずはデータの準備
データはStanford大学の統計学部からprostateのデータをダウンロード、正規化、訓練データ、テストデータに分けて使います。
> # Download prostate data
> con = "http://statweb.stanford.edu/~tibs/ElemStatLearn/datasets/prostate.data"
> prostate=read.csv(con,row.names=1,sep="\t")
>
> # Scale data and prepare train/test split
> prost.std <- data.frame(cbind(scale(prostate[,1:8]),prostate$lpsa))
> names(prost.std)[9] <- 'lpsa'
> data.train <- prost.std[prostate$train,]
> data.test <- prost.std[!prostate$train,]
> y.test <- data.test$lpsa
> n.train <- nrow(data.train)
OLS
単純な最小二乗法でMSEを求めてみます。
> m.ols <- lm(lpsa ~ . , data=data.train)
> summary(m.ols)

Call:
lm(formula = lpsa ~ ., data = data.train)

Residuals:
     Min       1Q   Median       3Q      Max
-1.64870 -0.34147 -0.05424  0.44941  1.48675

Coefficients:
            Estimate Std. Error t value Pr(>|t|)
(Intercept)  2.46493    0.08931  27.598  < 2e-16 ***
lcavol       0.67953    0.12663   5.366 1.47e-06 ***
lweight      0.26305    0.09563   2.751  0.00792 **
age         -0.14146    0.10134  -1.396  0.16806
lbph         0.21015    0.10222   2.056  0.04431 *
svi          0.30520    0.12360   2.469  0.01651 *
lcp         -0.28849    0.15453  -1.867  0.06697 .
gleason     -0.02131    0.14525  -0.147  0.88389
pgg45        0.26696    0.15361   1.738  0.08755 .
---
Signif. codes:
0 ‘***’ 0.001 ‘**’ 0.01 ‘*’ 0.05 ‘.’ 0.1 ‘ ’ 1

Residual standard error: 0.7123 on 58 degrees of freedom
Multiple R-squared:  0.6944,	Adjusted R-squared:  0.6522
F-statistic: 16.47 on 8 and 58 DF,  p-value: 2.042e-12

> y.pred.ols <- predict(m.ols,data.test)
> summary((y.pred.ols - y.test)^2)
    Min.  1st Qu.   Median     Mean  3rd Qu.     Max.
0.000209 0.044030 0.116400 0.521300 0.445000 4.097000
>
> mse.ols=sum((y.pred.ols - y.test)^2)
> mse.ols
[1] 15.63822
特徴選択
次に特徴量を減らしてみます。
leap関数でCp(Process Capability Index)をもとに特徴選択を行った上で、MSEを求めます。
whichで確認すると、gleasonを削ったモデルが良さそうだと判断されてます。
> library(leaps)
> l <- leaps(data.train[,1:8],data.train[,9],method='Cp')
> plot(l$size,l$Cp)
>
> # Select best model according to Cp
> bestfeat <- l$which[which.min(l$Cp),]
> bestfeat
    1     2     3     4     5     6     7     8
 TRUE  TRUE  TRUE  TRUE  TRUE  TRUE FALSE  TRUE
>
> # Train and test the model on the best subset
> m.bestsubset <- lm(lpsa ~ .,data=data.train[,bestfeat])
> summary(m.bestsubset)

Call:
lm(formula = lpsa ~ ., data = data.train[, bestfeat])

Residuals:
     Min       1Q   Median       3Q      Max
-1.65425 -0.34471 -0.05615  0.44380  1.48952

Coefficients:
            Estimate Std. Error t value Pr(>|t|)
(Intercept)  2.46687    0.08760  28.161  < 2e-16 ***
lcavol       0.67645    0.12384   5.462 9.88e-07 ***
lweight      0.26528    0.09363   2.833   0.0063 **
age         -0.14503    0.09757  -1.486   0.1425
lbph         0.20953    0.10128   2.069   0.0430 *
svi          0.30709    0.12190   2.519   0.0145 *
lcp         -0.28722    0.15300  -1.877   0.0654 .
pgg45        0.25228    0.11562   2.182   0.0331 *
---
Signif. codes:  0 ‘***’ 0.001 ‘**’ 0.01 ‘*’ 0.05 ‘.’ 0.1 ‘ ’ 1

Residual standard error: 0.7064 on 59 degrees of freedom
Multiple R-squared:  0.6943,	Adjusted R-squared:  0.658
F-statistic: 19.14 on 7 and 59 DF,  p-value: 4.496e-13

> y.pred.bestsubset <- predict(m.bestsubset,data.test[,bestfeat])
> summary((y.pred.bestsubset - y.test)^2)
    Min.  1st Qu.   Median     Mean  3rd Qu.     Max.
0.000575 0.038000 0.122400 0.516500 0.449300 4.002000
>
> mse.bestsubset=sum((y.pred.bestsubset - y.test)^2)
> mse.bestsubset
[1] 15.4954
リッジ回帰
次にリッジ回帰でやってみます。
リッジ回帰とラッソについて、なんだっけという場合は下記がご参考。
tjo.hatenablog.com
で、さくっとやってみます。
> library(MASS)
> m.ridge <- lm.ridge(lpsa ~ .,data=data.train, lambda = seq(0,20,0.1))
> plot(m.ridge)
>
> #by using the select function
> select(m.ridge)
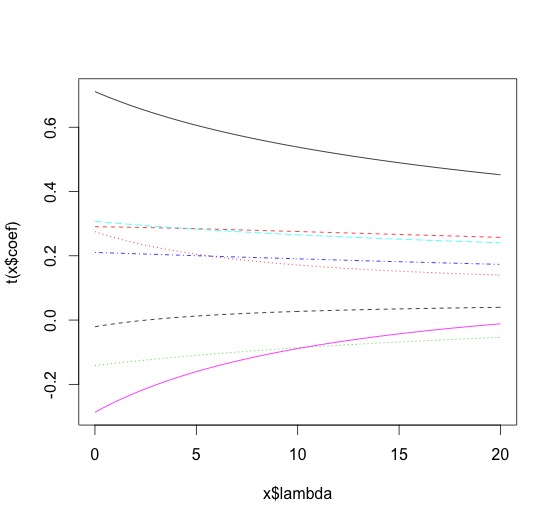
modified HKB estimator is 3.355691
modified L-W estimator is 3.050708
smallest value of GCV  at 4.9
下記のような図と共に、ベストなλは4.9だと選ばれました。
次に予測値を返させて、MSEを求めます。
> y.pred.ridge = scale(data.test[,1:8],center = m.ridge$xm, scale = m.ridge$scales)%*% m.ridge$coef[,which.min(m.ridge$GCV)] + m.ridge$ym
> summary((y.pred.ridge - y.test)^2)
       V1
 Min.   :0.000003
 1st Qu.:0.043863
 Median :0.136450
 Mean   :0.494410
 3rd Qu.:0.443495
 Max.   :3.809051
> mse.ridge=sum((y.pred.ridge - y.test)^2)
> mse.ridge
[1] 14.8323
ラッソ
あまり使っている見ませんが、larsライブラリー(https://cran.r-project.org/web/packages/lars/index.html)を使います。
> library(lars)
> m.lasso <- lars(as.matrix(data.train[,1:8]),data.train$lpsa,type="lasso")
> plot(m.lasso)
> # Cross-validation
> r <- cv.lars(as.matrix(data.train[,1:8]),data.train$lpsa)
> bestfraction <- r$index[which.min(r$cv)]
> bestfraction
[1] 0.5252525
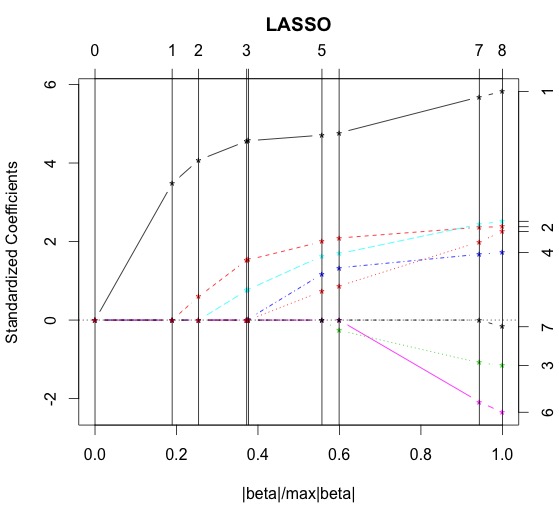
fractionは0.525あたりと図と出力から判断出来ます。
> # Observe coefficients
> coef.lasso <- predict(m.lasso,as.matrix(data.test[,1:8]),s=bestfraction,type="coefficient",mode="fraction")
>
> # Prediction
> y.pred.lasso <- predict(m.lasso,as.matrix(data.test[,1:8]),s=bestfraction,type="fit",mode="fraction")$fit
> summary((y.pred.lasso - y.test)^2)
    Min.  1st Qu.   Median     Mean  3rd Qu.     Max.
0.000144 0.072470 0.128000 0.454000 0.394400 3.565000
>
> mse.lasso=sum((y.pred.lasso - y.test)^2)
> mse.lasso
[1] 13.61874
>
平均二乗誤差の比較
> # Compare them
> mse.ols
[1] 15.63822
> mse.bestsubset
[1] 15.4954
> mse.ridge
[1] 14.8323
> mse.lasso
[1] 13.61874
今回のデータに関しては、ラッソで行った分析が一番MSEを最小に出来ました。
PRML 7章 サポートベクトルマシン
パターン認識と機械学習、第7章「Sparse Kernel Machines」に入ってSVMの実装をしてみます。
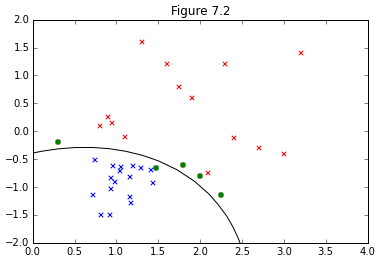
図7.2の再現を行うにあたり、カーネルがガウジアンカーネルが選択されているようなので、今回の実装もこれに従います。
いつも通り境界面の求め方など、SVMそのものの解説はPRMLやはじパタにお任せするとして、実装にあたっての流れだけ簡単に示します。
実装の大まかな流れ
①ラグランジュ関数の双対表現 (7.10)について、二次計画法で解く。
非線形計画法の自前での実装はムリ!って言われたので、おとなしくソルバーを使いました。無償かつポピュラーっぽいcvxoptというライブラリーが良さ気なのでインストール。

上記のようにドキュメントに従ってcvxoptでモデル化するには(7.10)のままだと見づらいので式変形。
表記的には気持ち悪い形ですが、ひとまず(7.10)'とcvxoptを見比べながらモデル化できたらそのままcvxoptに解いてもらうとラグランジュ乗数が求まります。
②SVMでは境界面の決定にサポートベクトルのみ関与し、これはKKT条件で絞り込まれます。
なんとなくまだ腹落ちしてないところもありますが、境界面上にあるベクトルはになるので、(7.16)より、
でないといけないと解釈。これを利用してサポートベクトルを抽出します。
③で、求まったサポートベクトルを使って(7.18)のを求めます。
④(7.13)に求めた値を代入して、境界面を求めます。
コード
今回、図を描くのにえらい苦労しまいた。どうしても境界面が上手くプロットできず、aidiaryさんのこちらの記事を全面的に参考にさせて頂きました。ありがとうございました。
import math
import matplotlib.pyplot as plt
from scipy import stats
from scipy.stats.kde import gaussian_kde
from pylab import *
import numpy as np
import random
import cvxopt
from cvxopt import matrix, solvers
%matplotlib inline

def kernel(x, y):
    sigma = 5.0
    return np.exp(-norm(x-y)**2 / (2 * (sigma ** 2)))

#(7.10)' (Quadratic Programming)
def L(t, X, N):
    K = np.zeros((N, N))
    for i in range(N):
        for j in range(N):
            K[i, j] = t[i] * t[j] * kernel(X[i], X[j])
    Q = matrix(K)
    p = matrix(-1 * np.ones(N))
    G = matrix(np.diag([-1.0]*N))
    h = matrix(np.zeros(N))
    A = matrix(t, (1,N))
    b = matrix(0.0)
    sol = solvers.qp(Q, p, G, h, A, b)
    a = array(sol['x']).reshape(N)
    return a

#(7.13)
def y_x(a, t, X, N, b, x):
    sum = 0
    for n in range(N):
        sum += a[n] * t[n] * kernel(x, X[n])
    return sum + b

#(7.18)
def b(a, t, X, S):
    sum_A = 0
    for n in S:
        sum_B = 0
        for m in S:
            sum_B += a[m] * t[m] * kernel(X[n], X[m])
        sum_A += (t[n] - sum_B)
    return sum_A/len(S)

if __name__ == "__main__":
    N = 36
    mu_blue = [1,-1]
    cov = [[0.1,0.05], [0.05,0.1]]

    x_blue,y_blue = np.random.multivariate_normal(mu_blue, cov, N/2).T

    x_red = [0.3, 0.8, 0.9, 0.95, 1.1, 1.3, 1.6, 1.9, 1.75, 1.8, 2.0, 2.1, 2.3, 2.25, 2.4, 2.7, 3.0, 3.2]
    y_red = [-0.2, 0.1, 0.25, 0.14, -0.1, 1.6, 1.2, 0.6, 0.8, -0.6, -0.8, -0.75, 1.2, -1.15, -0.12, -0.3, -0.4, 1.4]

    t_blue = np.ones((1, N/2))
    t_red = -1*np.ones((1, N/2))

    blue = vstack((x_blue, y_blue))
    red = vstack((x_red, y_red))

    X = np.concatenate((blue, red), axis=1).T
    t = np.concatenate((t_blue, t_red), axis=1).T

    #(7.10)' (Quadratic Programming)
    a = L(t, X, N)

    #Extract Index of support vectors from (7.14)
    S = []
    for n in range(len(a)):
        if a[n] < 0.0001: continue
        S.append(n)

    #(7.18)
    b = b(a, t, X, S)


    #Plot train data sets
    plt.scatter(x_blue,y_blue,color='b',marker='x')
    plt.scatter(x_red,y_red,color='r',marker='x')

    # Enphasize suport vectors
    for n in S:
        plt.scatter(X[n,0], X[n,1], color='g', marker='o')

    # Plot the decision surface
    X1, X2 = meshgrid(linspace(-10,10,100), linspace(-10,10,100))
    w, h = X1.shape
    X1.resize(X1.size)
    X2.resize(X2.size)
    Z = array([y_x(a, t, X, N, b, array([x1,x2])) for (x1, x2) in zip(X1, X2)])
    X1.resize((w, h))
    X2.resize((w, h))
    Z.resize((w, h))
    CS = contour(X1, X2, Z, [0.0], colors='k', linewidths=1, origin='lower')
    xlim(0, 4)
    ylim(-2, 2)
    title("Figure 7.2")
結果
